App Store Conversion Rate Optimization: From Impression to Install
Learn how to optimize every stage of the App Store conversion funnel. Benchmarks by category, screenshot optimization tactics, A/B testing strategies, and proven techniques to turn impressions into installs.
Your app gets 10,000 impressions per week. Your conversion rate is 4%. That means 400 installs. If you improve conversion to 6%, you get 600 installs from the exact same traffic. No additional marketing spend. No new campaigns. Just a better listing.
That is why conversion rate optimization (CRO) is the highest-leverage activity in App Store marketing. Most developers obsess over getting more impressions. The smart ones focus on converting the impressions they already have.
This guide walks you through the entire App Store conversion funnel, from impression to install, with benchmarks, optimization tactics, and real strategies that move the needle. If you need the foundational overview first, start with our complete ASO guide.
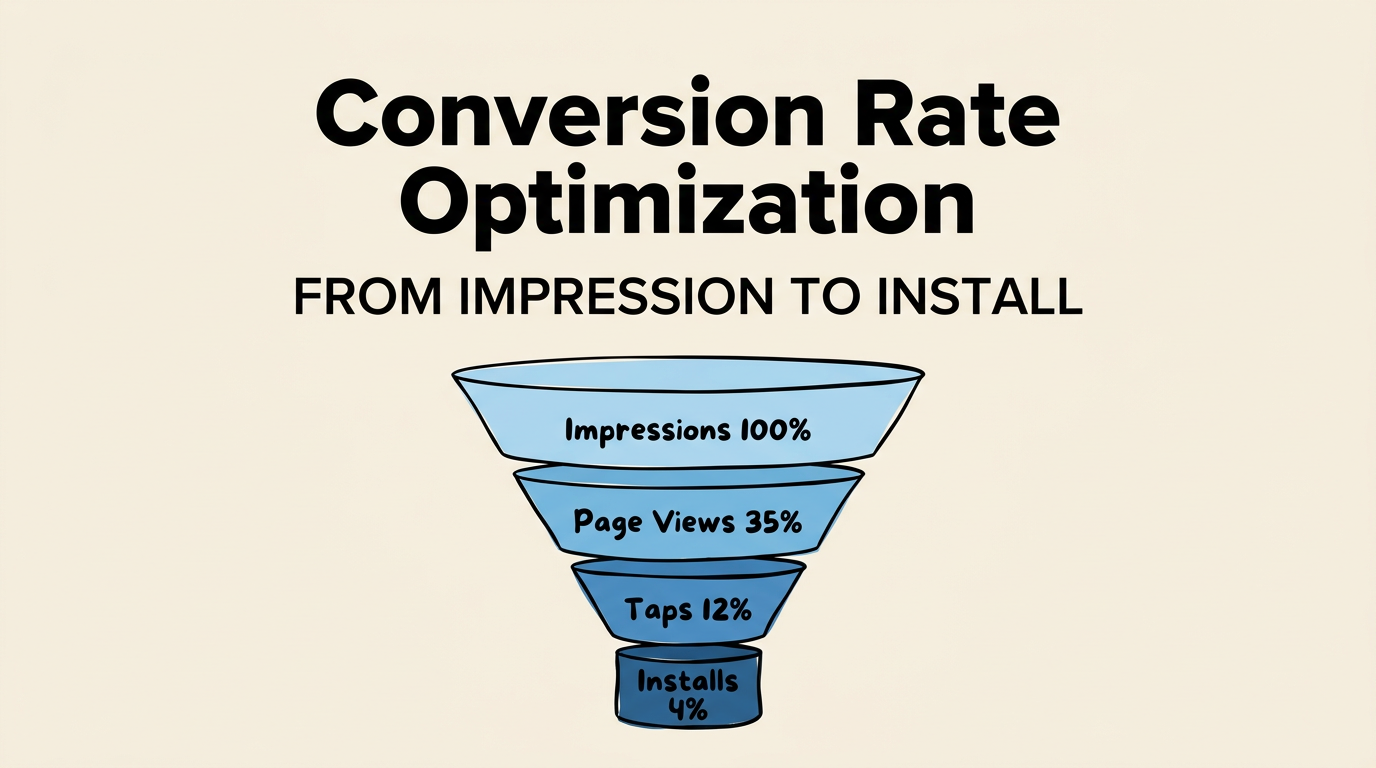
Understanding the App Store Conversion Funnel
The path from discovery to download has four distinct stages. Each stage has its own drop-off rate, and each one can be optimized independently.
| Stage | What Happens | Key Elements | Avg. Drop-off |
|---|---|---|---|
| Impression | User sees your app in search results | Icon, Title, Subtitle | 60-75% |
| Tap | User taps to view your listing | Screenshots (visible in search), Ratings badge | 40-55% |
| Product Page View | User reviews your full listing | Screenshots, Description, Ratings, Reviews | 50-70% |
| Install | User taps “Get” | Price/Free label, App size, Age rating | 5-15% |
The overall conversion rate from impression to install typically ranges from 3% to 10%, depending on category, app type, and listing quality. The biggest drop-off happens between impression and tap. Users make a snap decision based on your icon, title, and the first visible screenshot.
Here is what that funnel looks like in numbers for an average app:
| Metric | Count | Rate |
|---|---|---|
| Impressions | 10,000 | 100% |
| Taps | 3,000 | 30% |
| Product page views | 2,500 | 25% |
| Installs | 500 | 5% |
Each 1% improvement at any stage compounds through the funnel. A 10% improvement in tap-through rate alone could mean 30-50% more installs.
Conversion Benchmarks by Category
Not all categories convert at the same rate. Utility apps convert higher because users have high intent (they need a specific tool). Games convert lower because users are browsing casually and have thousands of alternatives.
| Category | Avg. Impression-to-Install | Avg. Page View-to-Install |
|---|---|---|
| Utilities | 6-10% | 35-50% |
| Productivity | 5-8% | 30-45% |
| Health & Fitness | 4-7% | 25-40% |
| Finance | 4-6% | 25-35% |
| Education | 3-6% | 20-35% |
| Social Networking | 3-5% | 20-30% |
| Photo & Video | 3-5% | 20-30% |
| Games | 2-4% | 15-25% |
| Entertainment | 2-4% | 15-25% |
If your conversion rate is below these benchmarks, you have significant room for improvement. If you are at or above them, focus on increasing impressions through better keyword targeting.
Optimizing the Impression Stage
At the impression stage, users see a tiny sliver of your app: icon, title, subtitle, and in many cases the first 2-3 screenshots. You have roughly 1-2 seconds to earn a tap.
Icon Optimization
Your icon is the first thing users process. It needs to be:
- Simple - One clear concept, not a busy collage
- Distinctive - Stand out from the blue/purple sea in most categories
- Recognizable at small sizes - Test at 60x60 pixels
- Consistent with your brand - If users see your icon elsewhere, they should recognize it
Avoid: text in icons (it is unreadable at search result size), excessive gradients, and generic stock imagery.
Title and Subtitle
Your title (30 characters) and subtitle (30 characters) need to accomplish two things simultaneously: communicate what your app does and include high-value keywords.
Strong examples:
- “Notion - Notes & Docs” (brand + core function)
- “Duolingo - Language Lessons” (brand + clear value)
- “YNAB: Budget & Finance” (brand + category keywords)
Weak examples:
- “SuperApp” (no context about what it does)
- “The Best Task Manager for Productivity” (too generic, wastes characters)
For detailed guidance on metadata optimization, see our metadata optimization guide.
Optimizing the Product Page
Once a user taps through to your product page, your screenshots become the dominant conversion element. They occupy the majority of the viewport and are the primary way users evaluate your app before installing.
Screenshot Strategy for Maximum Conversion
The data is clear: screenshots are the single biggest lever for product page conversion. Our analysis of top-performing apps reveals consistent patterns.
| Practice | Conversion Impact |
|---|---|
| Professional design with device frames | +25-35% vs. raw screenshots |
| Keyword-rich captions | +15-20% vs. no captions |
| First screenshot highlighting #1 benefit | +20-30% vs. feature list |
| Consistent visual theme across all screenshots | +10-15% vs. inconsistent |
| Social proof in screenshots (awards, stats) | +10-20% lift |
The first screenshot matters most. It is visible in search results without tapping, and on the product page it is the only screenshot guaranteed to be seen. Make it count by highlighting your single strongest selling point. For guidance, read our first screenshot strategy guide.
Caption quality drives both conversion and search. Since Apple’s OCR system reads your screenshot captions and indexes them for search, well-written captions serve double duty. They convince users to install AND improve your keyword coverage. See our screenshot caption guide for writing techniques.
Design consistency signals professionalism. Use a consistent color palette, typography, and layout across all screenshots. This signals that your app is well-built and trustworthy. Check our design principles guide for the specifics.
Description Optimization
The App Store description is not indexed for search (a common misconception). However, it plays a role in conversion, especially for users who scroll past your screenshots.
The first three lines are critical. They appear without tapping “more,” so front-load your strongest value proposition. Use short paragraphs, bullet points, and clear benefit statements. Avoid walls of text.
Promotional Text
The promotional text field (170 characters) appears above your description and can be updated without a new app submission. Use it for:
- Limited-time offers or sales
- New feature announcements
- Seasonal messaging
- Social proof updates (“Now with 1 million users!”)
A/B Testing Your Product Page
Apple’s Product Page Optimization (PPO) feature lets you test up to three treatment variants against your default listing. You can test different:
- Screenshots (order, design, content)
- App icon
- App preview videos
How to run an effective test:
- Isolate one variable - If you change both screenshots and icon, you will not know which drove the result.
- Wait for statistical significance - Apple provides confidence metrics. Do not stop a test early just because one variant is ahead.
- Run tests for 7+ days - This accounts for day-of-week variation.
- Test big changes first - Test entirely different screenshot approaches before testing minor copy tweaks.
| Test Type | Expected Impact | Time to Significance |
|---|---|---|
| Screenshot redesign | 10-30% | 7-14 days |
| Caption text changes | 5-15% | 14-21 days |
| Icon change | 5-20% | 7-14 days |
| Screenshot order swap | 3-10% | 14-28 days |
| Preview video vs. none | 5-25% | 7-14 days |
For detailed A/B testing strategies, see our screenshot A/B testing guide.
The Role of Ratings and Social Proof
Ratings are a conversion multiplier. Users use the rating badge as a quick trust signal before they ever tap on your listing.
The conversion impact of ratings:
| Rating Range | Relative Conversion Rate |
|---|---|
| 4.5 - 5.0 stars | Baseline (best) |
| 4.0 - 4.4 stars | -10 to -15% |
| 3.5 - 3.9 stars | -20 to -30% |
| 3.0 - 3.4 stars | -40 to -50% |
| Below 3.0 stars | -60 to -70% |
Below 4.0 stars, your conversion rate takes a significant hit. Below 3.5, most users will not even consider installing. Prioritize getting your rating above 4.0 before investing heavily in other conversion optimizations.
Rating count matters too. An app with 4.7 stars and 50 ratings is less trustworthy than one with 4.5 stars and 5,000 ratings. Volume signals that the rating is stable and reliable.
For a comprehensive ratings strategy, see our ratings and reviews guide.
Advanced CRO Techniques
Once you have optimized the basics, here are advanced techniques that can squeeze additional conversion gains:
Localized Product Pages
Different markets respond to different messaging. A screenshot caption that converts well in the US might fall flat in Japan. Localize not just the language but the entire approach: imagery, social proof, feature emphasis, and cultural references.
Custom Product Pages
Apple allows up to 35 custom product pages, each with unique screenshots, previews, and promotional text. Use these for:
- Paid ad campaigns targeting specific features
- Different user segments (e.g., beginners vs. power users)
- Seasonal promotions
- App Clips and deep links
Preview Videos
App preview videos auto-play in search results (muted) and on the product page. When done well, they can increase conversion by 15-25%. When done poorly (too long, confusing, no captions), they actually decrease conversion. If you use a video, make sure the first 3 seconds are compelling and the video is under 30 seconds.
Dark Mode Optimization
A significant portion of iPhone users run dark mode. Test your screenshots in both light and dark mode to ensure they look great in both contexts. Our dark mode screenshot guide covers this in detail.
Measuring and Tracking Conversion
App Store Connect provides the core metrics you need:
| Metric | Where to Find It | What It Tells You |
|---|---|---|
| Impressions | Analytics > Metrics | How often your app appears in search/browse |
| Product page views | Analytics > Metrics | How many users visit your listing |
| Conversion rate | Analytics > Metrics | % of views that become installs |
| Tap-through rate | Calculated | Views / Impressions |
| Source breakdown | Analytics > Sources | Which channels drive traffic |
Track these weekly and correlate changes with your optimization efforts. The goal is a clear upward trend in conversion rate over time.
Set up a simple spreadsheet:
- Record your baseline conversion rate before any changes
- Log every change you make (date, what changed, why)
- Measure the impact 2-3 weeks after each change
- Keep what works, revert what does not
Frequently Asked Questions
What is a good conversion rate for the App Store? It depends on your category. Utility apps typically convert at 6-10% (impression to install), while games convert at 2-4%. If you are within these ranges, you are doing fine. If you are significantly below, there is room for improvement. Focus on category-specific benchmarks rather than absolute numbers.
Should I optimize for conversion or impressions first? Conversion first, always. There is no point in driving 100,000 impressions if your conversion rate is 1%. Fix the leaky bucket before you turn up the faucet. Once your conversion rate is at or above category benchmarks, shift focus to increasing impressions through keyword optimization.
Do screenshots really matter that much for conversion? Yes. Screenshots are the single biggest visual element on your product page and the primary way users evaluate your app. Multiple studies and A/B tests consistently show that professional, well-captioned screenshots outperform raw screenshots by 25-35% in conversion rate. They are the most impactful change most developers can make.
How many screenshots should I upload? Upload all 10 allowed screenshots. While most users only view the first 3-4, having a complete set signals professionalism and gives power users the information they need to convert. Each additional screenshot also provides more OCR keyword real estate.
Can custom product pages improve my conversion rate? Absolutely. Custom product pages let you tailor your messaging to specific audiences. An ad campaign targeting “budget tracking” users can lead to a custom page that emphasizes budget features, while a campaign targeting “expense reports” leads to a page emphasizing that feature. This relevance significantly improves conversion from paid traffic.